SARS-CoV-2
COVID-19: What You Need to Know
 1. WHAT IS COVID-19?
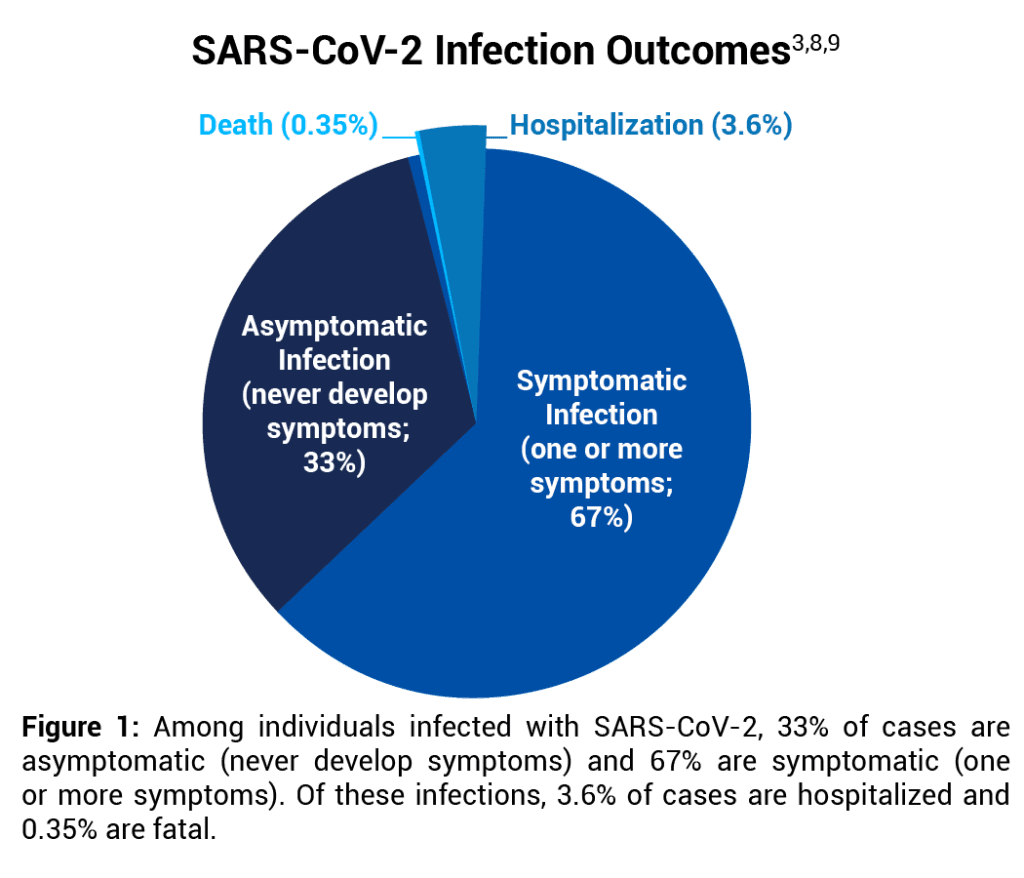
COVID-19 (coronavirus disease 2019) is an acute respiratory illness caused by SARS-CoV-2, a coronavirus strain among seven coronaviruses known to infect humans.1 Other coronavirus infections include those due to seasonal (common cold) coronaviruses (229E, NL63, OC43 and HKU1), which cause up to a third of community-acquired upper respiratory tract infections,2 as well as MERS-CoV and SARS-CoV-1. Approximately 33%3 of SARS-CoV-2 infections are asymptomatic (never develop symptoms). However, when symptoms do occur, they happen 2–14 days after infection and range from mild to severe fever or chills, difficulty breathing, fatigue, muscle or body aches, headache, new loss of taste or smell, sore throat, nasal congestion or runny nose, nausea or vomiting, or diarrhea.4 Most people’s symptoms are short-lived, but some do have prolonged symptoms.5 Overall, more than 99.6% of people infected with SARS-CoV-2 recover.6 The strongest risk factors for fatal COVID-19 are obesity, anxiety disorders, and diabetes.7

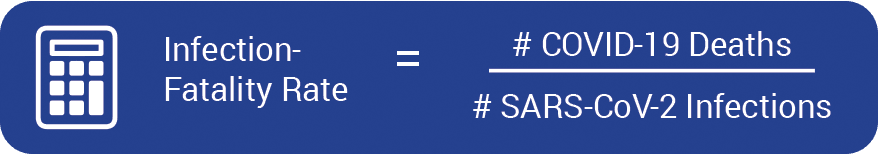
2. WHAT IS THE INFECTION-FATALITY RATE OF COVID-19?
The infection-fatality rate (IFR) of COVID-19 is calculated by dividing the number of people who die from COVID-19 by the total number of people infected, including both symptomatic and asymptomatic cases.
A Stanford University systematic review that included 69 antibody studies estimated that the COVID-19 IFR in the United States ranges from 0.3% to 0.4%.8 Data analysis herein uses the midpoint of that range, 0.35%. See Figure 1.
An IFR of 0.35% is supported by an analysis published in Clinical Infectious Diseases that estimated that there were 44.8 million symptomatic COVID-19 illnesses in February–September 2020 in the U.S.9 Since 33% of all SARS-CoV-2 infections are asymptomatic,3 there were an estimated 66.9 million (44.8 million/[100%-33%]) total number of SARS-CoV-2 infections in that time period. There were also 213,000 COVID-19 deaths in February–September 2020,10 resulting in a COVID-19 IFR of 0.32% (213,000/66.9 million).
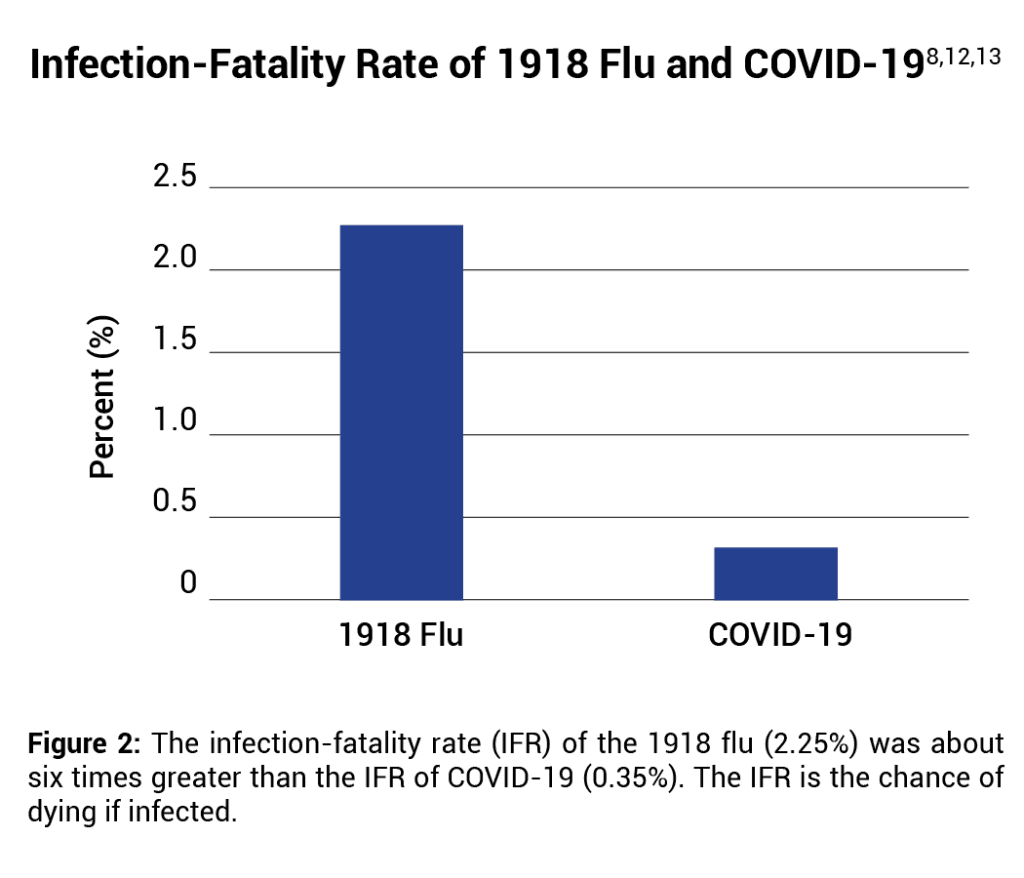
When the pandemic began in early 2020, it was proposed that COVID-19 may be of comparable lethality to influenza in 1918.11 However, the IFR of the 1918 flu (2.25%) was about six times greater than the IFR of COVID-19 (0.35%).12,13 See Figure 2.
 3. WHAT IS THE IFR OF COVID-19 IN DIFFERENT AGE GROUPS?
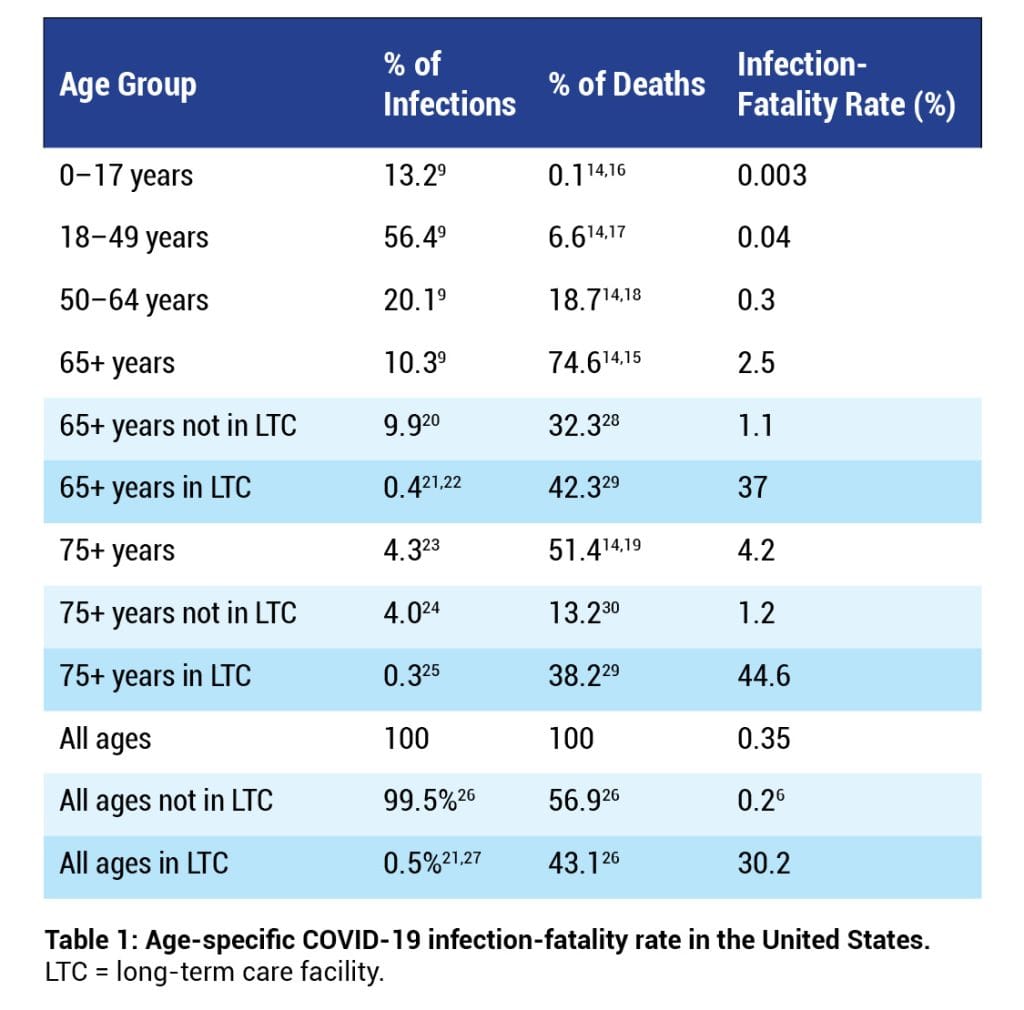
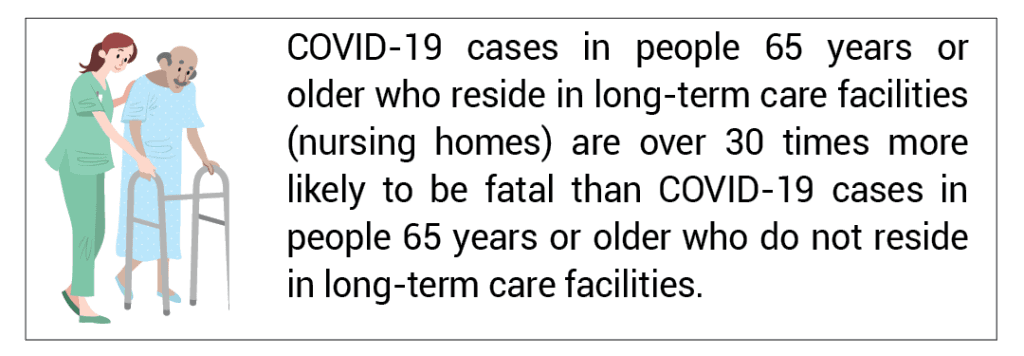
About 75% of COVID-19 deaths occur in individuals aged 65 years or older,14,15 whereas about 0.1% of COVID-19 deaths occur in individuals aged 17 years or younger14,16 (Table 16,9,14-30). In addition, severe COVID-19 is particularly lethal in nursing homes.8,31 For example, in 2020, 59% of all COVID-19 deaths in the state of Massachusetts occurred in long-term care (LTC) facilities.32 The national COVID-19 IFR is 0.2% among individuals who do not live in long-term care institutions.6
Table 1 shows that a COVID-19 infection in an individual 65 years or older dwelling in an LTC facility is over 30 times more likely to be fatal (37%/1.1%) than in an individual 65 years or older not dwelling in an LTC facility. Furthermore, most people who die in nursing homes die within six months of placement; therefore, many COVID-19 nursing home deaths may have occurred in people with a life expectancy of only a few months.33
 4. WHAT IS THE DIFFERENCE BETWEEN BEING EXPOSED AND BEING INFECTED WITH SARS-COV-2?
Although the IFR measures the chance of dying assuming infection with SARS-CoV-2, the IFR does not include the chance of being exposed or the chance of being infected. Research shows that not everyone who is exposed to SARS-CoV-2 is necessarily infected with it, as T cells may protect against, or modify, infection.34-36 A BMJ article investigating whether people have pre-existing immunity to SARS-CoV-2 states that “at least six studies have reported T cell reactivity against SARS-CoV-2 in 20% to 50% of people with no known exposure to the virus.”34 In addition, a study published in Nature Immunology states: “T cells control viral infections and provide immunological memory that enables long-lasting protection… Cross-reactivity of T cells for different virus species or even among different pathogens is a well-known phenomenon postulated to enable heterologous immunity to a pathogen after exposure to a nonidentical pathogen.”36 The study found, “Cross-reactive SARS-CoV-2 peptides revealed pre-existing T cell responses in 81% of unexposed individuals and validated similarity with common cold coronaviruses.”36
 5. CAN PREVIOUS INFECTION BE PROTECTIVE AGAINST REINFECTION?
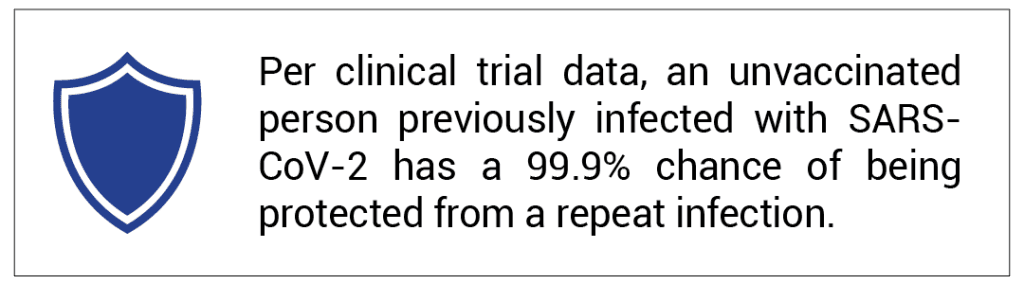
The Johnson & Johnson vaccine clinical trial observed that an unvaccinated person previously infected with SARS-CoV-2 has a 99.9% chance of being protected from a repeat infection.37
 6. WHAT TREATMENT OR PREVENTION OPTIONS ARE AVAILABLE FOR COVID-19?
Treatments for COVID-19 have improved significantly since the pandemic began in early 2020, resulting in improved survival rates in hospitalized cases.38,39 Many studies have observed the effectiveness of various treatments, the most studied being ivermectin, vitamin D, hydroxychloroquine (HCQ), and monoclonal antibodies.40,41 Studies have also observed that ivermectin, vitamin D, and hydroxychloroquine may be beneficial for prophylaxis (i.e., pre-exposure or post-exposure prevention of symptomatic COVID-19 infections).42-46
Mass vaccination with COVID-19 vaccines was introduced in December 2020. The vaccines have been shown to significantly prevent symptomatic COVID-19 cases that are not hospitalized or fatal. However, studies have shown that the vaccine may not prevent the spread of COVID-19, may not have a measurable impact on COVID-19 mortality, and may lead to more severe adverse events than it prevents.47
REFERENCES
- Centers for Disease Control and Prevention. Washington, D.C.: U.S. Department of Health and Human Services. Human coronavirus types; [cited 2021 Jun 20]. https://physiciansforinformedconsent.org/cdc-human-coronavirus-types.
- Poland GA, Ovsyannikova IG, Kennedy RB. SARS-CoV-2 immunity: review and applications to phase 3 vaccine candidates. Lancet. 2020 Nov 14;396(10262):1595-1606. https://www.thelancet.com/journals/lancet/article/PIIS0140-6736(20)32137-1/fulltext.
- Oran DP, Topol EJ. The proportion of SARS-CoV-2 infections that are asymptomatic: a systematic review. Ann Intern Med. 2021 May;174(5):655-62. https://www.acpjournals.org/doi/10.7326/M20-6976.
- Centers for Disease Control and Prevention. Washington, D.C.: U.S. Department of Health and Human Services. Symptoms of COVID-19; [cited 2024 Aug 31]. https://physiciansforinformedconsent.org/cdc-symptoms-of-covid-19.
- Tenforde MW, Kim SS, Lindsell CJ, Billig Rose E, Shapiro NI, Files DC, Gibbs KW, Erickson HL, Steingrub JS, Smithline HA, Gong MN, Aboodi MS, Exline MC, Henning DJ, Wilson JG, Khan A, Qadir N, Brown SM, Peltan ID, Rice TW, Hager DN, Ginde AA, Stubblefield WB, Patel MM, Self WH, Feldstein LR; IVY Network Investigators; CDC COVID-19 Response Team; IVY Network Investigators. Symptom duration and risk factors for delayed return to usual health among outpatients with COVID-19 in a multistate health care systems network—United States, March–June 2020. MMWR Morb Mortal Wkly Rep. 2020 Jul 31;69(30):993-8. https://www.ncbi.nlm.nih.gov/pmc/articles/PMC7392393/.
- Ioannidis, JPA. Reconciling estimates of global spread and infection fatality rates of COVID- 19: an overview of systematic evaluations. Eur J Clin Invest. 2021;51:e13554. https://onlinelibrary.wiley.com/doi/epdf/10.1111/eci.13554.
- Kompaniyets L, Pennington AF, Goodman AB, Rosenblum HG, Belay B, Ko JY, Chevinsky JR, Schieber LZ, Summers AD, Lavery AM, Preston LE, Danielson ML, Cui Z, Namulanda G, Yusuf H, Mac Kenzie WR, Wong KK, Baggs J, Boehmer TK, Gundlapalli AV. Underlying medical conditions and severe illness among 540,667 adults hospitalized with COVID-19, March 2020-March 2021. Prev Chronic Dis. 2021 Jul 1;18:E66. https://pubmed.ncbi.nlm.nih.gov/34197283/.
- Ioannidis JPA. Infection fatality rate of COVID-19 inferred from seroprevalence data. Bull World Health Organ. 2021 Jan 1;99(1):19-33F. https://www.ncbi.nlm.nih.gov/pmc/articles/PMC7947934/.
- Reese H, Iuliano AD, Patel NN, Garg S, Kim L, Silk BJ, Hall AJ, Fry A, Reed C. Estimated incidence of coronavirus disease 2019 (COVID-19) illness and hospitalization—United States, February–September 2020. Clin Infect Dis. 2021 Jun 15;72(12):e1010-e1017. https://academic.oup.com/cid/article/72/12/e1010/6000389.
- Worldometer. Coronavirus: United States. https://www.worldometers.info/coronavirus/country/us/.
- Ferguson NM, Laydon D, Nedjati-Gilani G, Imai N, Ainslie K, Baguelin M, Bhatia S, Boonyasiri A, Cucunubá Z, Cuomo-Dannenburg G, Dighe A, Dorigatti I, H Fu, Gaythorpe K, Green W, Hamlet A, Hinsley W, Okell LC, van Elsland S, Thompson H, Verity R, Volz E, Wang H, Wang Y, Walker PGT, Walters C, Winskill P, Whittaker C, Donnelly CA, Riley S, Ghani AC. Report 9: impact of non-pharmaceutical interventions (NPIs) to reduce COVID-19 mortality and healthcare demand. London (UK): Imperial College London; 2020 Mar 16 [cited 2021 Jul 26]. https://www.imperial.ac.uk/media/imperial-college/medicine/sph/ide/gida-fellowships/Imperial-College-COVID19-NPI-modelling-16-03-2020.pdf.
- Glezen WP. Emerging infections: pandemic influenza. Epidemiol Rev. 1996; 18(1):64-76. https://academic.oup.com/epirev/article/18/1/64/ 447194; the 1918 flu infected 29% of 103 million people and killed 675,000, resulting in an IFR of 2.25%.
- Davis LE, Caldwell GG, Lynch RE, Bailey RE, Chin TD. Hong Kong influenza: the epidemiologic features of a high school family study analyzed and compared with a similar study during the 1957 Asian influenza epidemic. Am J Epidemiol. 1970 Oct;92(4):240-7. https://academic.oup.com/aje/article-abstract/92/4/240/184095?redirectedFrom=fulltext; data collected during flu pandemics show that counting all illnesses with influenza-like symptoms as flu cases results in similar rates of infection as serologic (antibody) testing. Thus, the case-fatality rate of the 1918 influenza pandemic is herein considered equivalent to an infection-fatality rate.
- Centers for Disease Control and Prevention. Washington, D.C.: U.S. Department of Health and Human Services. CDC wonder: about underlying cause of death, 2018-2022, single race; [cited 2024 Aug 8]. https://wonder.cdc.gov/ucd-icd10-expanded.html. Query for COVID-19 deaths of all ages, 2020-2022.
- Centers for Disease Control and Prevention. Washington, D.C.: U.S. Department of Health and Human Services. CDC wonder: about underlying cause of death, 2018-2022, single race; [cited 2024 Aug 8]. https://wonder.cdc.gov/ucd-icd10-expanded.html. Query for COVID-19 deaths of age 65 or older, 2020-2022.
- Centers for Disease Control and Prevention. Washington, D.C.: U.S. Department of Health and Human Services. CDC wonder: about underlying cause of death, 2018-2022, single race; [cited 2024 Aug 8]. https://wonder.cdc.gov/ucd-icd10-expanded.html. Query for COVID-19 deaths of age 17 or younger, 2020-2022.
- Centers for Disease Control and Prevention. Washington, D.C.: U.S. Department of Health and Human Services. CDC wonder: about underlying cause of death, 2018-2022, single race; [cited 2024 Aug 8]. https://wonder.cdc.gov/ucd-icd10-expanded.html. Query for COVID-19 deaths of age 18 to 49, 2020-2022.
- Centers for Disease Control and Prevention. Washington, D.C.: U.S. Department of Health and Human Services. CDC wonder: about underlying cause of death, 2018-2022, single race; [cited 2024 Aug 8]. https://wonder.cdc.gov/ucd-icd10-expanded.html. Query for COVID-19 deaths of age 50 to 64, 2020-2022.
- Centers for Disease Control and Prevention. Washington, D.C.: U.S. Department of Health and Human Services. CDC wonder: about underlying cause of death, 2018-2022, single race; [cited 2024 Aug 8]. https://wonder.cdc.gov/ucd-icd10-expanded.html. Query for COVID-19 deaths of age 75 or older, 2020-2022.
- Since 10.3% of SARS-CoV-2 infections in the U.S. were 65 or older and 0.4% of SARS-CoV-2 infections in the U.S. were 65 or older in LTCs,22 9.9% (10.3% – 0.4%) of SARS-CoV-2 infections in the U.S. were 65 or older and not in LTCs.
- Harris-Kojetin L, Sengupta M, Lendon JP, Rome V, Valverde R, Caffrey C. Long-term care providers and services users in the United States, 2015-2016. National Center for Health Statistics. Vital Health Stat 3(43). Feb 2019. Table VIII: long-term care services users, by selected characteristics and sector—United States, 2015-2016; 76. https://www.cdc.gov/nchs/data/series/sr_03/sr03_43-508.pdf.
- Of the 2.16 million residents of nursing homes and residential care communities in 2016, 1.88 million were 65 or older.21 Those 1.88 million residents comprised 3.82% of the population 65 or older in 2016; therefore, we estimated that 3.82% of all SARS-CoV-2 infections in that age group occurred in LTCs. The total number of infections in LTCs is 0.4% (3.82%*10.3%) of all infections in the U.S.
- Since the population 75 or older is 41.9% of the population 65 or older, we estimated that 41.9% of all SARS-CoV-2 infections 65 or older were 75 or older. The total number of infections is 4.3% (41.9%*10.3%) of all infections in the U.S.
- Since 4.3% of SARS-CoV-2 infections in the U.S. were 75 or older23 and 0.3% of SARS-CoV-2 infections in the U.S. were 75 or older in LTCs,25 4% (4.3% – 0.3%) of SARS-CoV-2 infections in the U.S. were 75 or older and not in LTCs.
- Of the 2.16 million residents of nursing homes and residential care communities in 2016, 1.55 million were 75 or older.21 Those 1.55 million residents comprised 7.5% of the population 75 or older in 2016; therefore, we estimated that 7.5% of all SARS-CoV-2 infections in that age group occurred in LTCs. The total number of infections in LTCs is 0.3% (7.5%*4.3%) of all infections in the U.S.
- Since 0.5% of all infections in the U.S. occurred in LTCs,27 99.5% (100% – 0.5%) of all infections occurred outside LTCs. Let X equal the % of all infections in the U.S. that occurred outside LTCs. Since the IFR excluding LTCs is 0.2%6 and that IFR is also equal to (0.35%*X)/99.5%, X = 56.9%.
- Of the 2.16 million residents of nursing homes and residential care communities in 2016, 276,000 were <65 and 1.88 million were 65 or older.21 The 276,000 is 0.44% of the population 50-64 years old in 2016; therefore, we estimated that 0.44% of all SARS-CoV-2 infections in that age group occurred in LTCs. The 1.88 million is 3.82% of the population 65 or older in 2016; therefore, we estimated that 3.82% of all SARS-CoV-2 infections in that age group occurred in LTCs. The total number of infections in LTCs is 0.5% (0.44%*20.1% + 3.82%*10.3%) of all infections in the U.S.
- Since 74.6% of COVID-19 deaths in the U.S. were 65 or older and 42.3% of COVID-19 deaths in the U.S. were 65 or older in LTCs,29 32.3% (74.6% – 42.3%) of COVID-19 deaths in the U.S. were 65 or older and not in LTCs.
- Label the LTC population 50-64 years old as population A, the LTC population 65-74 years old as population B, and the LTC population 75 or older as population C. Table 1 shows the IFR of the population 50-64 years old regardless of LTC status (IFRa) was 0.3%. The IFR of the population 65-74 years of age regardless of LTC status (IFRb) is the difference in deaths between the 65 or older group and 75 or older group divided by the difference in infections of those groups: 1.4% (0.35%*[74.6%-51.4%]/[10.3%-4.3%]). Table 1 shows the IFR in the population 75 years or older regardless of LTC status (IFRc) was 4.2%. Table 1 also shows that the total number of LTC COVID-19 deaths is 43.1% of all COVID-19 deaths. Let Ia, Ib, and Ic be the % of all infections comprised by LTC infections in each age group. Ia = 0.09% (0.44%*20.1%);27 Ib = 0.1% (0.4% – 0.3%, Table 1); and Ic = 0.3% (Table 1).Let Da, Db, and Dc be the % of all COVID-19 deaths comprised by each group. Da, Db, and Dc can be solved using the following system of equations:
Da + Db + Dc = 43.1%
IFRb / IFRa = (Db / Ib) / (Da / Ia)
IFRc / IFRa = (Dc / Ic) / (Da / Ia)
Solving the system of equations above for Da, Db, and Dc results in Da = 0.8%, Db = 4.1%, and Dc = 38.2%. - Since 51.4% of COVID-19 deaths in the U.S. were 75 or older and 38.2% of COVID-19 deaths in the U.S. were 75 or older in LTCs,29 13.2% (51.4% – 38.2%) of COVID-19 deaths in the U.S. were 75 or older and not in LTCs.
- The COVID Tracking Project. Washington, D.C.: The Atlantic Monthly Group. Long-term care COVID tracker; [cited 2021 Apr 20]. https://covidtracking.com/nursing-homes-long-term-care-facilities.
- Massachusetts Department of Public Health. Boston (MA): Commonwealth of Massachusetts. Massachusetts Department of Public Health COVID-19 dashboard; 2020 Dec 31 [cited 2021 Apr 16]. https://www.mass.gov/doc/covid-19-dashboard-december-31-2020/download.
- Kelly A, Conell-Price J, Covinsky K, Cenzer IS, Chang A, Boscardin WJ, Smith AK. Lengths of stay for older adults residing in nursing homes at the end of life. J Am Geriatr Soc. 2010 Sep;58(9):1701-6. https://www.ncbi.nlm.nih.gov/pmc/articles/PMC2945440/.
- Doshi P. Covid-19: Do many people have pre-existing immunity? BMJ. 2020 Sep 17;370:m3563. https://www.bmj.com/content/370/bmj.m3563.
- Sekine T, Perez-Potti A, Rivera-Ballesteros O, Strålin K, Gorin JB, Olsson A, Llewellyn-Lacey S, Kamal H, Bogdanovic G, Muschiol S, Wullimann DJ, Kammann T, Emgård J, Parrot T, Folkesson E; Karolinska COVID-19 Study Group, Rooyackers O, Eriksson LI, Henter JI, Sönnerborg A, Allander T, Albert J, Nielsen M, Klingström J, Gredmark-Russ S, Björkström NK, Sandberg JK, Price DA, Ljunggren HG, Aleman S, Buggert M. Robust T cell immunity in convalescent individuals with asymptomatic or mild COVID-19. Cell. 2020 Oct 1;183(1):158-68.e14. https://www.sciencedirect.com/science/article/pii/S0092867420310084.
- Nelde A, Bilich T, Heitmann JS, Maringer Y, Salih HR, Roerden M, Lübke M, Bauer J, Rieth J, Wacker M, Peter A, Hörber S, Traenkle B, Kaiser PD, Rothbauer U, Becker M, Junker D, Krause G, Strengert M, Schneiderhan-Marra N, Templin MF, Joos TO, Kowalewski DJ, Stos-Zweifel V, Fehr M, Rabsteyn A, Mirakaj V, Karbach J, Jäger E, Graf M, Gruber LC, Rachfalski D, Preuß B, Hagelstein I, Märklin M, Bakchoul T, Gouttefangeas C, Kohlbacher O, Klein R, Stevanović S, Rammensee HG, Walz JS. SARS-CoV-2-derived peptides define heterologous and COVID-19-induced T cell recognition. Nat Immunol. 2021 Jan;22(1):74-85. https://www.nature.com/articles/s41590-020-00808-x.
- U.S. Food and Drug Administration, Vaccines and Related Biological Products Advisory Committee. FDA briefing document: Janssen Ad26.COV2.S vaccine for the prevention of COVID-19. Vaccines and Related Biological Products Advisory Committee Meeting: February 26, 2021. Table 14: vaccine efficacy of first occurrence of moderate to severe/critical COVID-19, including non-centrally confirmed cases, with onset at least 14 or at least 28 days after vaccination, by baseline SARS-CoV-2 status, per protocol set; 30. https://www.fda.gov/media/146217/download.
- Horwitz LI, Jones SA, Cerfolio RJ, Francois F, Greco J, Rudy B, Petrilli CM. Trends in COVID-19 risk-adjusted mortality rates. J Hosp Med. 2021 Feb;16(2):90-2. https://www.journalofhospitalmedicine.com/jhospmed/article/230561/hospital-medicine/trends-covid-19-risk-adjusted-mortality-rates.
- Dennis JM, McGovern AP, Vollmer SJ, Mateen BA. Improving survival of critical care patients with coronavirus disease 2019 in England: a national cohort study, March to June 2020. Crit Care Med. 2021 Feb 1;49(2):209-14. https://www.ncbi.nlm.nih.gov/pmc/articles/PMC7803441/.
- C19early.com. COVID-19 early treatment: real-time analysis of 711 studies; [cited 2021 Jun 21]. https://c19early.com/.
- U.S. Food and Drug Administration. Silver Spring (MD): U.S. Food and Drug Administration. FDA news release — FDA roundup: March 22, 2024; [cited 2024 Aug 30]. https://www.fda.gov/news-events/press-announcements/fda-roundup-march-22-2024.
- C19early.com. COVID-19 studies: ivermectin; [cited 2021 Jun 21]. https://c19ivermectin.com.
- Bryant A, Lawrie TA, Dowswell T, Fordham EJ, Mitchell S, Hill SR, Tham TC. Ivermectin for prevention and treatment of COVID-19 infection: a systematic review, meta-analysis, and trial sequential analysis to inform clinical guidelines. Am J Ther. 2021 Jun 21;28(4):e434-60. https://www.ncbi.nlm.nih.gov/pmc/articles/PMC8248252/.
- C19early.com. COVID-19 studies: vitamin D; [cited 2021 Jun 21]. https://c19vitamind.com.
- Ilie PC, Stefanescu S, Smith L. The role of vitamin D in the prevention of coronavirus disease 2019 infection and mortality. Aging Clin Exp Res. 2020 Jul;32(7):1195-8. https://www.ncbi.nlm.nih.gov/pmc/articles/PMC7202265/.
- C19early.com. HCQ for COVID-19: real-time meta analysis of 261 studies; [cited 2021 Jun 30]. https://hcqmeta.com.
- Physicians for Informed Consent. Newport Beach (CA): Physicians for Informed Consent. COVID-19 vaccine mandates: 21 scientific facts that challenge the assumptions. 2022 Feb; updated 2024 Nov. https://physiciansforinformedconsent.org/covid-19-vaccine-risk-statement/.
Published 2020 Jun; updated 2024 Nov